Did the Fed Create the Stock Boom After 2008?
Central Banks and Equity Markets Since 2008: Cash Flows or Discount Rates?
January 28, 2026
Some figures (Figure 1, 2) are from: “The End of Privilege: A Reexamination of the Net Foreign Asset Position of the United States” (Atkeson, Heathcote, Perri, 2025, American Economic Review).
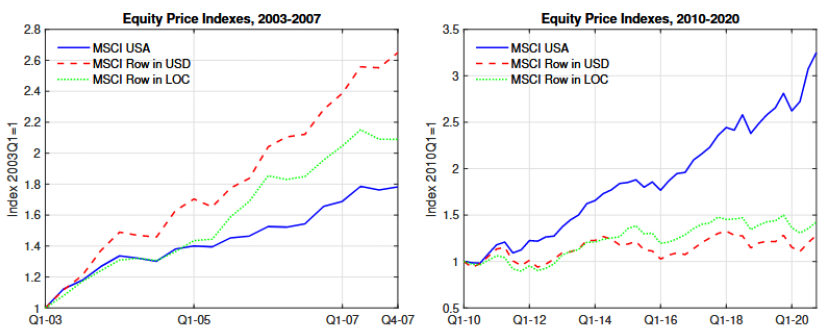
After 2010, U.S. equities diverged
After 2010, U.S. equities sharply outperformed the rest of the world—a reversal from the pre-2008 pattern. If this outperformance reflected fundamentals, we should expect U.S. firms to generate substantially more cash than global peers. Otherwise, it is a bubble driven by lower discount rates.
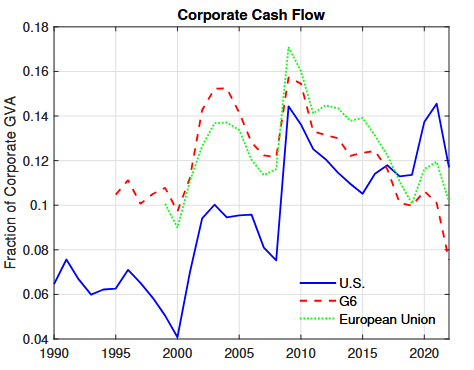
Do U.S. firms generate more cash?
A simple way to check fundamentals is to ask whether U.S. corporates began producing much more usable cash.
“Fraction of Corporate GVA” ≈ of the value companies create, how much turns into cash they can actually use.
Since around 2000, U.S. corporate cash flow gradually caught up to the G6 and the EU, and by 2020 modestly overtook them. That improvement is real—but the visual magnitude is much smaller than the divergence in equity prices, when comparing Figure 1 to Figure 2.
The missing piece: monetary policy (bubble)?
After 2008, the Fed began using its balance sheet as an active policy tool through quantitative easing (QE) and related programs. This looks like a structural break in how financial conditions were set.
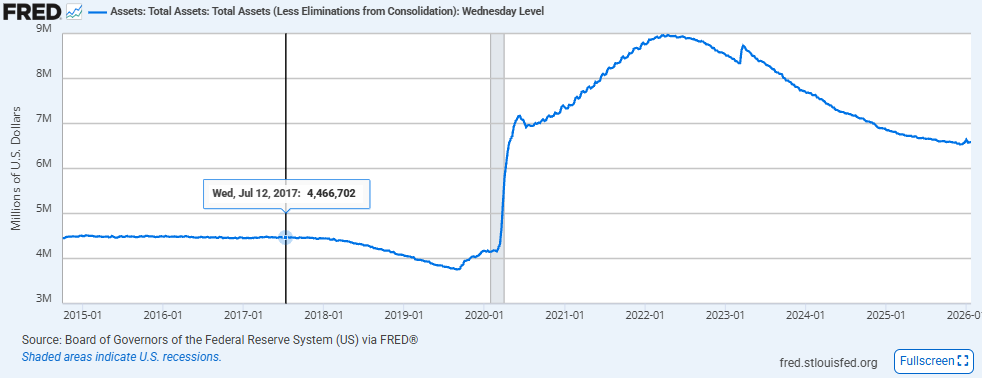
When the Fed expands its balance sheet, it tends to compress long-term yields and term premia—mechanically boosting the present value of distant cash flows.
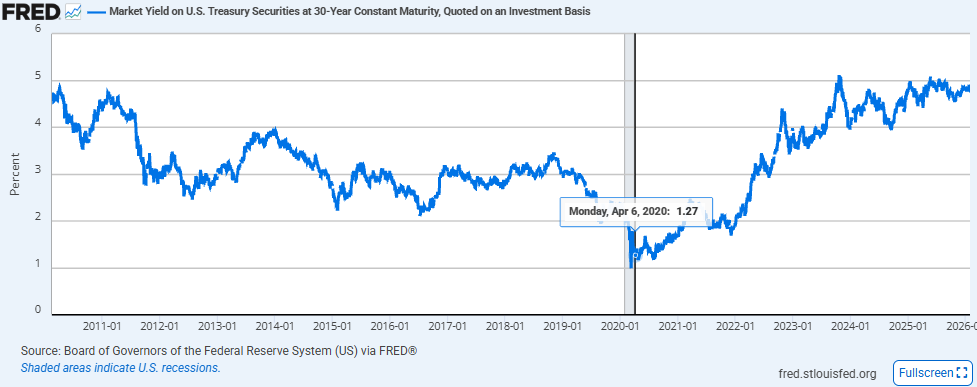
Who benefited most?
If discount rates were the dominant force, long-duration assets (claims on far-future cash flows) should react (benefit) the most. A simple “poster child” is ARKK.
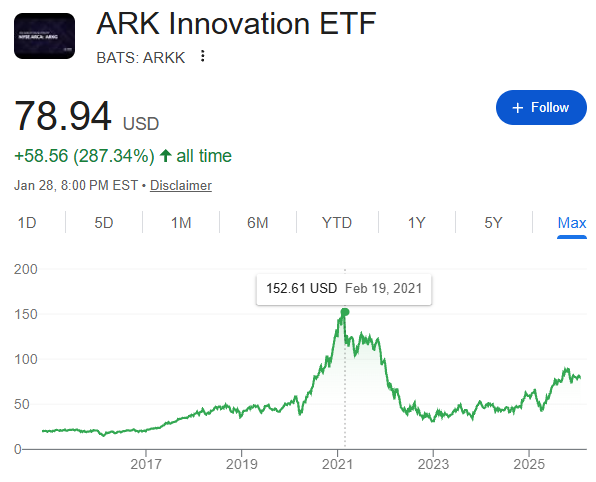
ARKK’s rise and fall closely coincided with liquidity conditions. A natural interpretation is that part of the “innovation premium” was real, but a large share of price movement reflected monetary conditions rather than realized innovation alone.
Two explanations for the post-2008 boom
- Cash-flow channel: U.S. firms were more innovative and profitable, producing higher future cash flows.
- Discount-rate channel: Cheap capital lowered discount rates. With lower discounting (and potentially less equity supply), prices rose even without proportional cash-flow growth.
There is evidence for both. “Innovation” funds often tracked monetary cycles closely (don’t fight the Fed), while a subset of mega-cap firms showed genuine cash-flow realization and resilience.
My takeaway
Forecasting short-term macro—next month’s inflation, the next recession, wars, or the stance of the next central bank chair—is notoriously challenging and often unreliable. Rather than betting everything on one macro call, portfolio construction across scenarios may be much more important, such as:
- Recognize which assets benefit from the base case (most likely forecast)
- Explicitly consider the opposing scenario
- Construct portfolios that can survive—and ideally adapt—across both cases
This post reflects personal opinions and is not investment advice.
← Back to Home